 By
By Sometimes it can be really difficult to understand what's happening with exceptions - especially in larger apps. Imagine that you're working on some code inside an existing project. You raise an exception, then something weird happens. Maybe the exception is swallowed. Maybe an environment variable is changed. Maybe your exception gets wrapped in another exception.
I'm going to show you a simple way to use TracePoints to get a little more information about exceptions in your app - even if those exceptions are swallowed.
A Convenient Example
The boundary between controllers and views in Rails is one spot where exceptions seem to defy logic. It's easy to see for yourself. Just raise an exception in a view and try to rescue it in a controller. You'll find that you CAN'T rescue the template error from the controller!
# pages_controller.rb

def index
  render
rescue
  # this will never run
  logger.debug "someone raised the roof"
end
# index.haml

- raise "the roof"
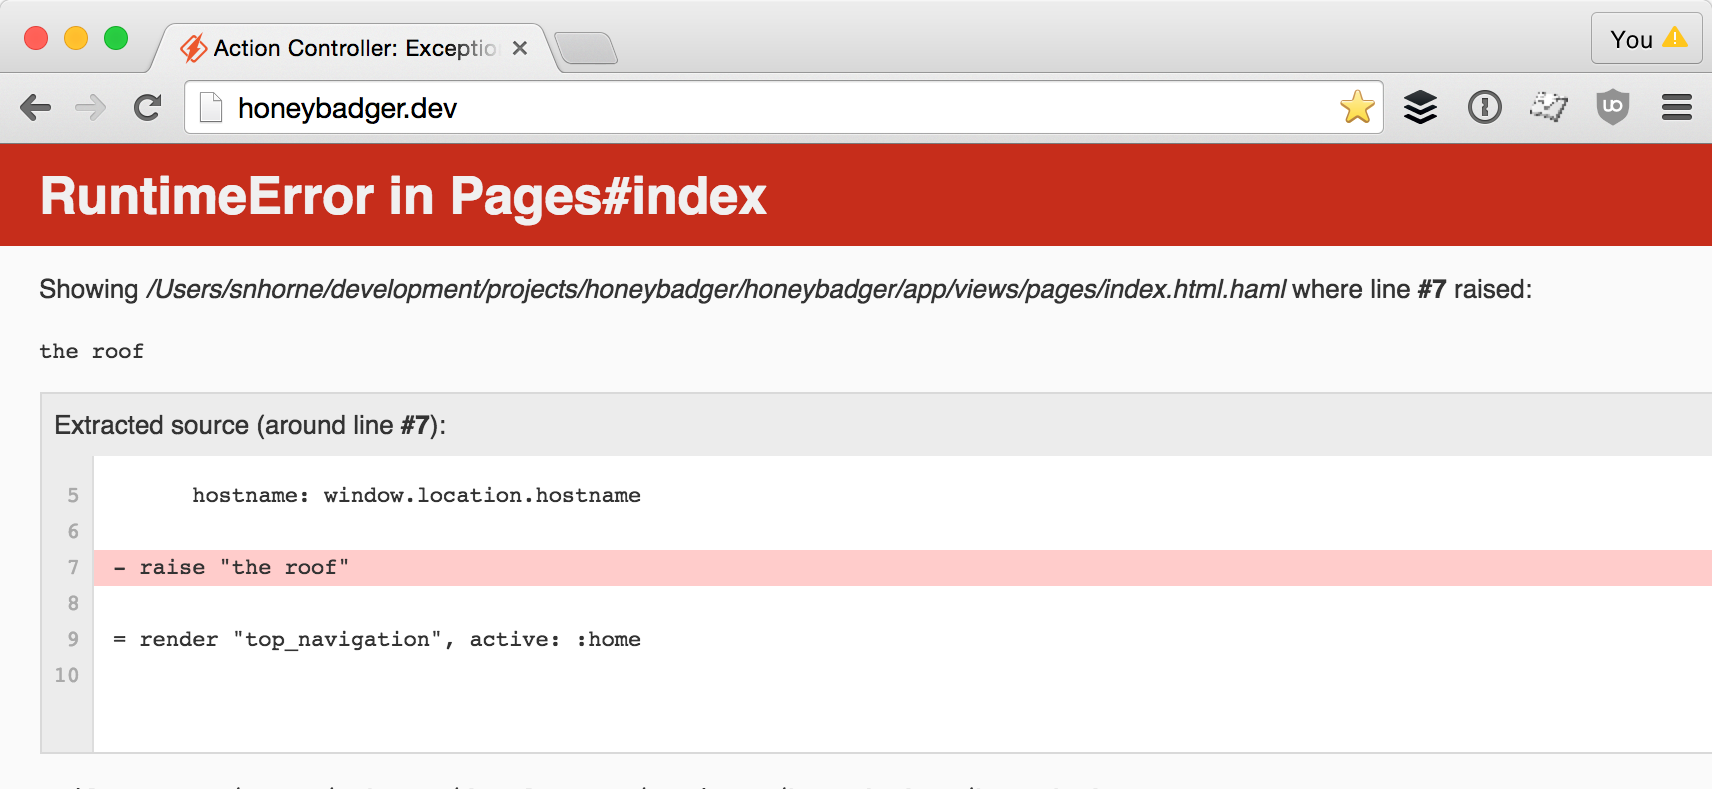 WTF!?! I thought I rescued this!
It's obvious that there's something tricky going on. Let's see if we can figure out what it is.
Logging All Exceptions With TracePoint
TracePoints are a really powerful introspection tool that have been around since Ruby 2.0. They allow you to define callbacks for a wide variety of runtime events. For example, you can be notified whenever a class is defined, whenever a method is called or whenever an exception is raised. Check out the TracePoint documentation for even more events.
Let's start by adding a TracePoint that is called whenever an exception is raised and writes a summary of it to the log.
class PagesController < ApplicationController
  def index
    TracePoint.new(:raise) do |tp|
      # tp.raised_exeption contains the actual exception object that was raised!
      logger.debug "#{tp.raised_exception.object_id}: #{tp.raised_exception.class} #{tp.raised_exception.message} ".yellow + tp.raised_exception.backtrace[0].sub(Rails.root.to_s, "").blue
    end.enable do
      render
    end
  end
end
If you're curious about the yellow and blue methods, I'm using the colorize gem. It adds ANSI color codes to the output.
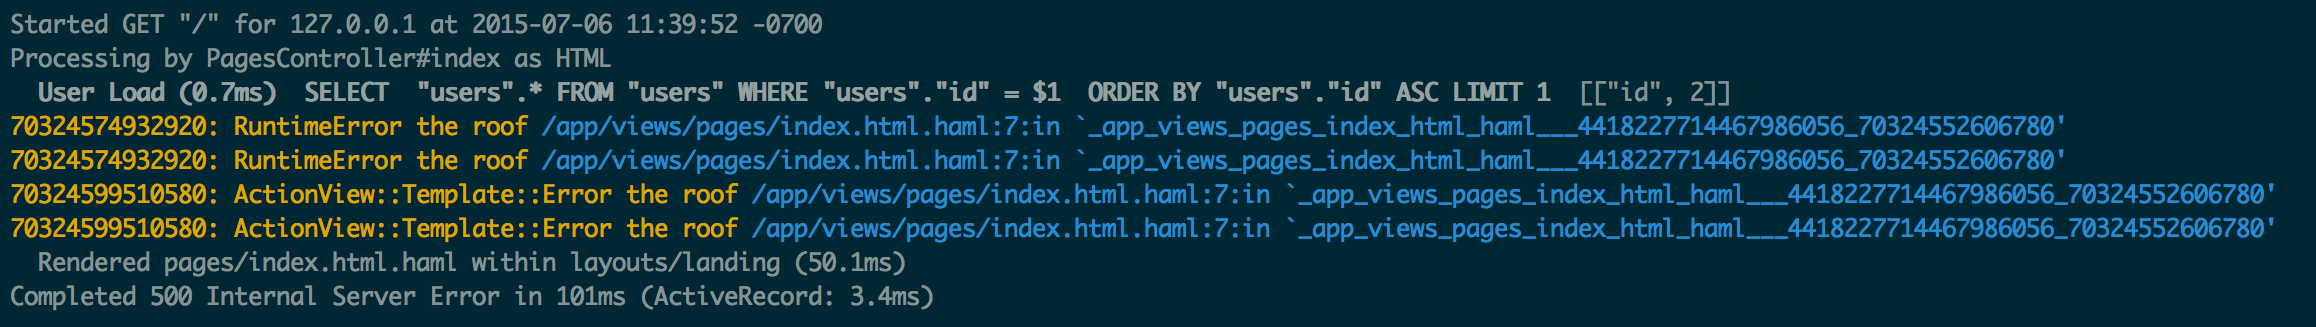
Now when I go and refresh my page, my logs look like the screenshot below. One interesting thing that you might notice is that there are two separate exceptions, and each of them is raised twice. That long number at the beginning of each line is the Exception's object id. That's how we know there are two exception objects, not four.
 This log shows every use of
 raise in the rendering process
Which Method Caused Which Raise?
Having a list of "raise" events is pretty useful. But it would be even better if we had some idea of which methods were causing each raise. Once again, TracePoint comes to the rescue.
TracePoint lets us add a handler that is called whenever a method returns. It's just as simple to use as the "raise" event was. In the example below we're logging every method return:
TracePoint.trace(:return) do |tp|
  logger.debug [tp.method_id, tp.lineno, tp.path.sub(Rails.root.to_s, "")].join(" : ").green
end
There's one problem though. If you add this code to your rails app, you'll find that your app stops responding to requests. There are so many method calls in the simplest Rails request that the server times out before it can write them all to the log.
Since we're really only interested in method calls that caused exceptions, lets modify our code to output the first two "return" events that happen after each exception.
class PagesController < ApplicationController
  def index
    counter = 0
    return_trace = TracePoint.trace(:return) do |tp|
      logger.debug "\t" + [tp.method_id, tp.lineno, tp.path.sub(Rails.root.to_s, "")].join(" : ").green
      if (counter += 1) > 3
        return_trace.disable
        counter = 0
      end
    end
    return_trace.disable # disable the tracepoint by default

    TracePoint.new(:raise) do |tp|
      logger.debug "#{tp.raised_exception.object_id}: #{tp.raised_exception.class} #{tp.raised_exception.message} ".yellow + tp.raised_exception.backtrace[0].sub(Rails.root.to_s, "").blue
      # The "raise" enables the "return" tracepoint
      return_trace.enable
    end.enable do
      render
    end

  end
end
When I refresh my browser, I see the following lines have been added to the log:
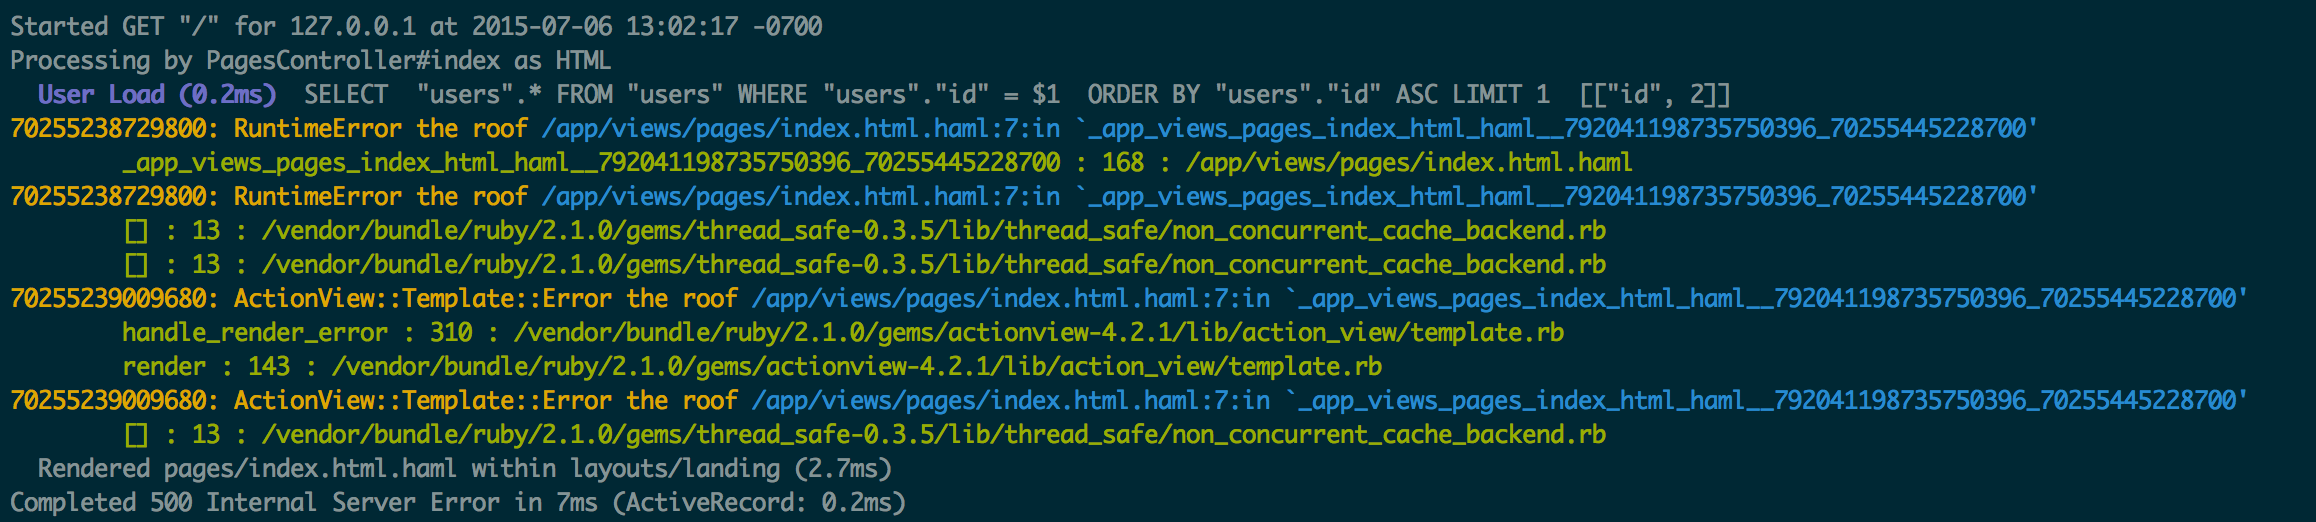 Each "raise" event is shown above the method which caused it
Because we only enable the "return" TracePoint when an exception is raised, the first "return" event is going to be from the method that raised the exception.
We can use this information to solve our mystery. Our original RuntimeError is being converted to an ActionView::Template::Error by the handle_render_error method on line 310 of template.rb.
The nice thing about this technique is that it doesn't have anything to do with Rails. You can use it any time you need to understand in greater detail which exceptions are being raise and caught under the hood.


 Molly Struve, Sr. Site Reliability Engineer, Netflix
