 By
By If you haven't seen byebug before, I recommend that you check it out. It's a great debugger for Ruby 2.x. In the words of its authors:
Byebug is a simple to use, feature rich debugger for Ruby 2. It uses the new TracePoint API for execution control and the new Debug Inspector API for call stack navigation, so it doesn't depend on internal core sources. It's developed as a C extension, so it's fast. And it has a full test suite so it's reliable.
The basic setup is pretty simple. Just install the gem. If you use the byebug method anywhere in your code, execution will stop at that point and you'll be dropped into a debug console. You can ever set it up to use pry.
For example, I could invoke the debugger like so:
require 'byebug'

def my_method
  a = 1
  byebug
end

my_method()
If I run that file, I get dropped into the debugger.
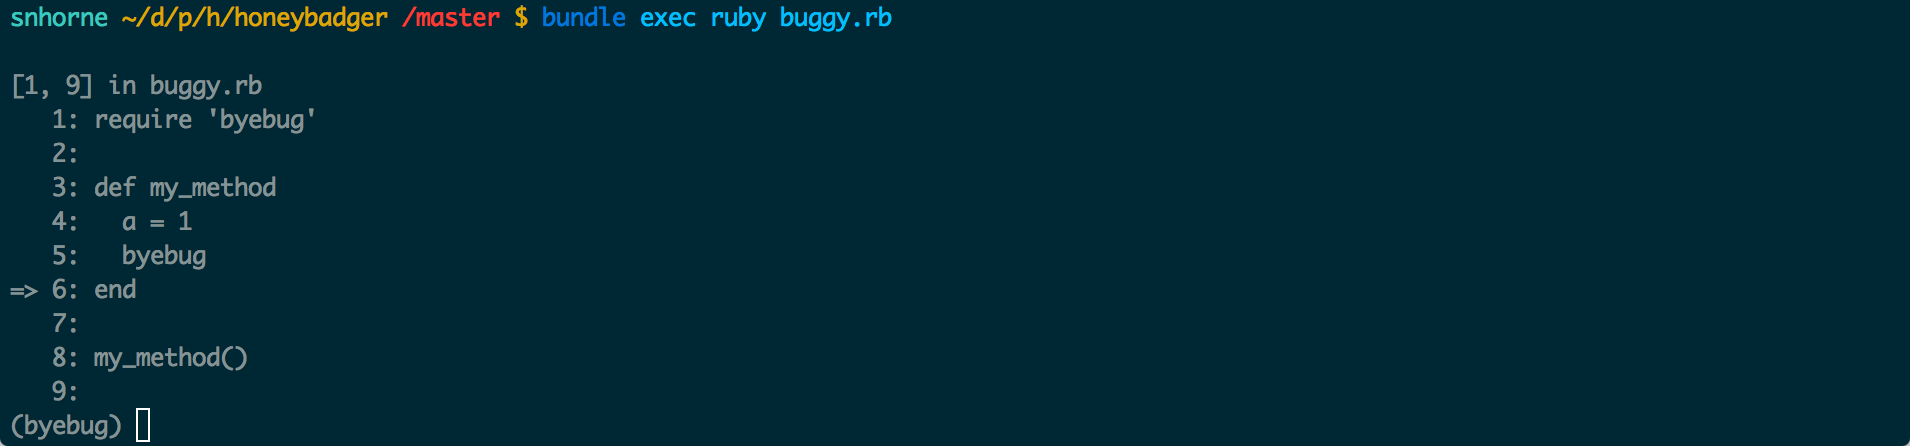 When the debugger is triggered, it drops you into an interactive shell.
The problem with Pow
That's fine if you can run you app on the command line. But what if you're developing a Rails app using pow to serve it locally?
Pow, like most app servers, runs in the background. So even if you did manage to stop execution and run the debugger, you wouldn't be able to interact with it!
Fortunately, byebug provides a mechanism for remote debugging.
If you're not familiar with remote debugging, it's a simple concept. When the byebug method is called, instead of dumping you to an interactive shell, the debugger fires up its own special server. You can then connect to this debug server using a command-line client.
What does remote debugging look like?
First, I call the byebug method to a controller action
class PagesController < ApplicationController
  def index
    if user_has_never_signed_in? && request.subdomain == "www"
      @hero_bg = ab_test("hero_bg", "control", "variable")
    else
      @hero_bg = "control"
    end

    byebug

  end
end
Second, I make a request to that action. The connection appears to hang.
 A web request that triggers the debugger doesn't load
Finally, I switch over to my byebug client, which is showing a debugger console at exactly the point I specified.
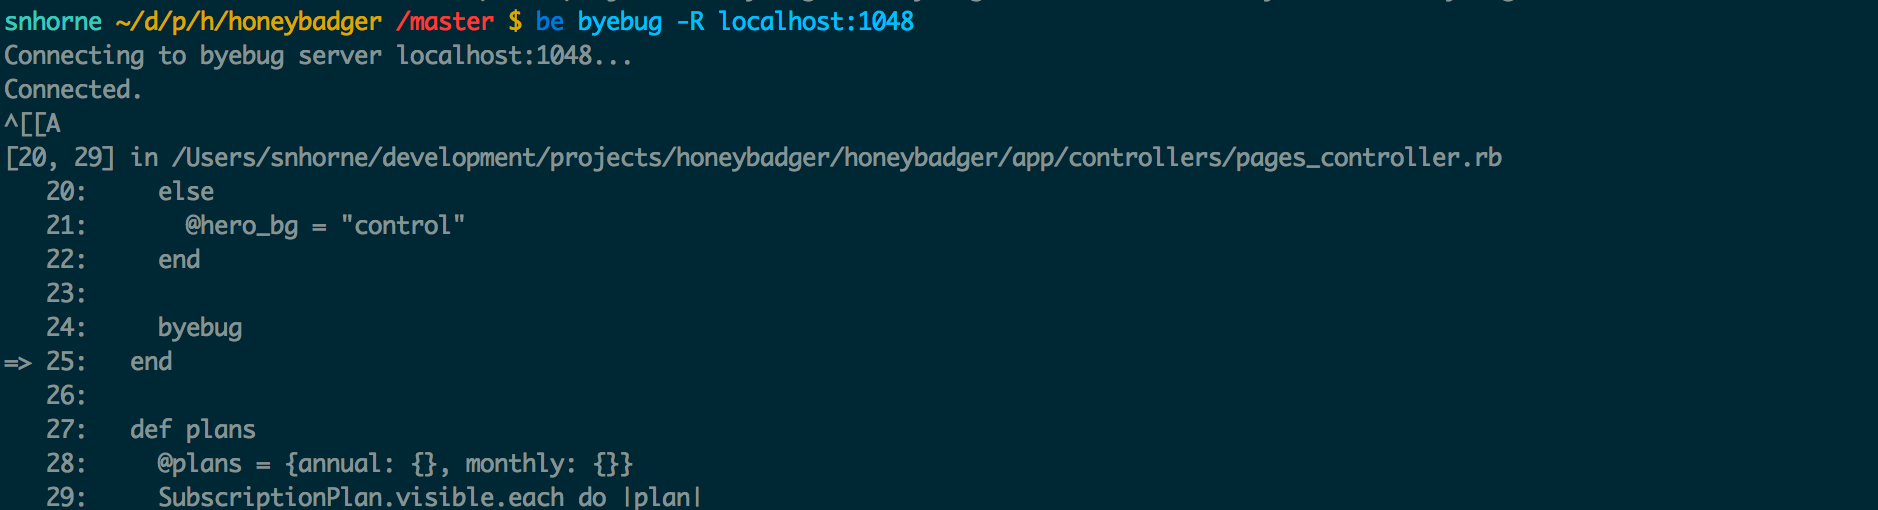 The byebug remote debugger in action
Setting up remote debugging with byebug
If you don't already have the gem installed, go ahead and install it.
# Gemfile

gem "byebug", group: "development"
Next, we need to add an initializer to our rails app that starts up the byebug server whenever pow starts our rails app. The only real option you need to provide is a port number. The code below lets you configure that via an environment variable.
Once you add this initializer, you'll probably need to to restart the app make sure that it's been loaded.
# config/initializers/byebug.rb

if Rails.env.development?
  Byebug.start_server 'localhost', ENV.fetch("BYEBUG_SERVER_PORT", 1048).to_i
end
Finally, you'll need to run the byebug client and tell it where to find our server. The client will then sit and wait for a debug trigger to occur.
If you used a different port, you'll need to substitute that here.
bundle exec byebug -R localhost:1048
That's it! Time to start debuggin'.


