 By
By Last year, I attended my first ElixirConf in Austin, TX. We were first-time sponsors of the conference and had just launched Honeybadger for Elixir, the first of its kind error tracking package for Elixir. My friend and Elixir-aficionado, Richard Bishop, wrote the code.
On the flight to Austin and over the course of the conference (in between talks and hanging out with awesome new friends) I read Introducing Elixir: Getting Started in Functional Programming by Simon St. Laurent. On the flight home (even though I was pretty exhausted) I started writing my first Elixir web service which would come to serve as an important part of our stack at Honeybadger. This is the story of that project.
The problem
Honeybadger provides an addon for Heroku which tracks application errors in Heroku apps. When an error happens (say, in your Rails or Phoenix app), Honeybadger catches it and reports it to our servers for analysis and alerting before allowing the application to continue to handle the error however it prefers.
Unfortunately, application errors are only half the story. What happens when something goes wrong outside of your application code? You might use something like our Uptime Monitoring to be alerted of catastrophic outages such as when EC2 is down, DNS fails, etc., but that doesn't cover transient issues which are outside of the application stack but may not result in a complete outage.
On Heroku there is an entire class of errors which can happen before your application code even runs (or sometimes when it times out or crashes fatally). The problem was that nobody was monitoring these errors (including us), and we wanted to fix that.
The plan
Heroku doesn't expose its platform errors anywhere, but it does log them. That means that if your app is timing out you can run heroku logs --tail to see what's going on. The logs look something like this:
288 <158>1 2015-08-04T23:49:21.287927+00:00 host heroku router - at=error code=H12 desc="Request timeout" method=GET path="/pages/timeout" host=crywolf.herokuapp.com request_id=ea2e64e5-1de5-4d93-b46c-5760f47814ae fwd="76.105.197.61" dyno=web.1 connect=2ms service=30000ms status=503 bytes=0
You can see the code=H12 tag which corresponds to the request timeout error code.
So there's no way to get the platform errors out of the application like we do with application errors, but there is a way to get the logs. Heroku's Logplex service exists for just that purpose. It allows you to set up a "log drain" which will then POST an application's logs to the HTTPS endpoint that you specify.
Additionally, Heroku addons can be configured to automatically create a log drain when the addon is installed. This is how log-monitoring addons work on Heroku.
So here's what we decided to do: monitor our customer's logs via Heroku's Logplex service, scan for Heroku platform errors, and then report them to our standard collector API, which is how we also collect application errors. Simple enough, right?
There was just one minor hurdle: a typical web app generates a lot of logs, and we're monitoring thousands of apps. If we're going to process every log for every Heroku application which uses Honeybadger, then we're going to need be fast. Like, tens of thousands of requests per second fast.
Enter Elixir
From elixir-lang.org:
Elixir is a dynamic, functional language designed for building scalable and maintainable applications.
Elixir leverages the Erlang VM, known for running low-latency, distributed and fault-tolerant systems, while also being successfully used in web development and the embedded software domain.
We had been hearing that Elixir was great for low-latency, high-trafic web applications and services for a while, and wanted to see for ourselves what all the fuss was about. This seemed like the perfect opportunity to get it running in production.
What emerged was a relatively simple (thanks in part to the clean, functional style of programming) web service with a single HTTP endpoint. Because we wanted to keep the code as lean as possible, I chose to build the app directly on Plug rather than Phoenix, the popular web framework for Elixir (Phoenix actually uses Plug for its middleware stack, similar to how Ruby on Rails uses Rack).
Plug
Plug allows you to develop composable modules for handling various parts of web applications which can be served directly by Cowboy, an HTTP server written in Erlang. Here's the canonical "Hello World" Plug application:
defmodule MyPlug do
  import Plug.Conn

  def init(options) do
    # initialize options

    options
  end

  def call(conn, _opts) do
    conn
    |> put_resp_content_type("text/plain")
    |> send_resp(200, "Hello world")
  end
end
You can also create a router which wires up the various plugs that sit between an endpoint and the server:
defmodule AppRouter do
  use Plug.Router

  plug :match
  plug :dispatch

  get "/hello" do
    send_resp(conn, 200, "world")
  end

  match _ do
    send_resp(conn, 404, "oops")
  end
end
Our solution
Our Plug application is just a handful of modules:
Clienthandles reporting logs to Honeybadger.Parserprovides functions to parse logs from Heroku Logplex.Loggeris a plug which logs information about each request internally.Routerwires everything up, parsing inbound requests with theParserand reporting Heroku platform errors to theClient, which reports them to our API.
To show how simple this really can be in Elixir, here's our full Plug router, in all its glory:
defmodule Logplex.Router do
  @moduledoc """
  Handles incoming requests via plug router.
  """

  use Plug.Router
  use Honeybadger.Plug

  alias Logplex.Client
  alias Logplex.Parser

  plug Plug.Statsd
  plug Logplex.Logger

  plug :match
  plug :dispatch

  post "/heroku/v1" do
    {:ok, body, _} = Plug.Conn.read_body(conn)
    %{query_params: params} = Plug.Conn.fetch_query_params(conn)
    process(body, params)
    send_resp(conn, 200, [])
  end

  match _ do
    send_resp(conn, 404, "wut?")
  end

  defp process(body, params) do
    Task.start fn ->
      errors = Parser.parse(body)
      Client.report(errors, params)
    end
  end
end
There are a few interesting things to note about the router which we'll look at briefly in turn:
We're monitoring our own errors with Honeybadger
You can see that we're using the plug from our error tracking package for Elixir (which I mentioned earlier), which provides its own plug that monitors all internal exceptions:
use Honeybadger.Plug
We're doing the work in separate processes
Elixir does concurrency via processes. Each request is handled inside its own process (by Cowboy/Plug), and we're creating an additional process (via the Task module) to scan the logs from each request (Heroku Logplex batches each application's logs, so there may be multiple lines in each payload):
  defp process(body, params) do
    Task.start fn ->
      errors = Parser.parse(body)
      Client.report(errors, params)
    end
  end
Each request to our API (which is what happens when Parser.parse/1 finds one or more platform errors) is also handled in a separate process (which happens inside the Client module:
  defp post(log, params) do
    Task.start fn ->
      StatsD.timing "notices.duration", fn ->
        _post(log, params)
      end
    end
  end
This helps us distribute all the different jobs across each node, which is one of the coolest parts of Erlang.
We're monitoring Elixir with StatsD
It's important for us to have detailed metrics about how our app is performing, and so we're using the ex_statsd package to collect the following metrics:
- The number of total requests from Heroku Logplex
- The duration of each request
- The number of platform errors scanned
- The number of platform errors reported
- The number of failures when reporting platform errors, by status code
...and we're monitoring Elixir with Honeybadger
We also recently released a new version of Honeybadger for Elixir which automatically sends request metrics to Honeybadger, which has been our number one feature request for Elixir monitoring. If you've been wanting this, it's now available as of version 0.5.0!
Deployment
We deployed the app to AWS EC2. We set up an autoscale group with two c4.large instances; we could probably get away with a single instance, but we figured it couldn't hurt to have some initial redundancy. When the CPU on either instance reaches 70%, an extra instance is launched; when the CPU drops below 70%, the extra instance(s) are terminated.
We're using exrm to build releases (another cool feature of Elixir) when we deploy, which has probably been the most difficult part of all of this (more on that later).
Results
Elixir's speed was immediately tangible, thanks to our metrics instrumentation. The first thing that jumped out at me was that our charts were measuring in microseconds, which is 1 millionth of a second (or 1 thousandth of a millisecond):
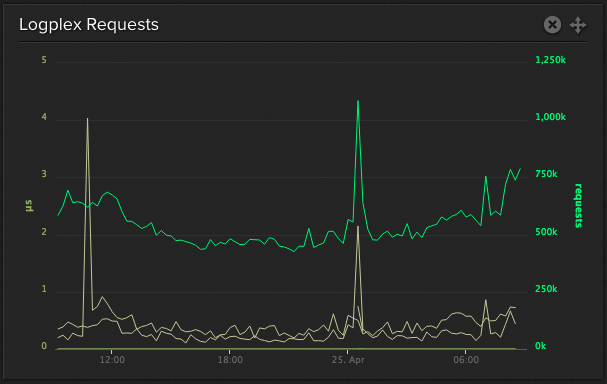
We regularly burst up to 100k requests per minute (rpm) and traffic is still increasing; our current traffic levels are for a subset of apps using our addon, so usage is growing as more apps sign up and older apps opt-in to Logplex monitoring.
Performance could improve
We've been finding that CPU usage tends to exceed 70% when we do burst past 100k rpm, causing new instances to be launched. We expected to be able to handle much more than ~1-2k requests per second (rps) on a single node. So, there's room for improvement there; it's possible that we have some tuning to do.
Deploying is hard
Probably the hardest part of Elixir has been deploying it. We wanted to take advantage of hot upgrades/downgrades, but we routinely have issues deploying new releases. Some of this may be due to our inexperience with "the Erlang way", and we'll always have more learning to do.
In the meantime we're considering changing our deployment strategy to run releases directly from rel/ and always do a cold restart of the app when deploying. Since we're running on AWS we can still get the benefits of zero-downtime deploys by doing rolling restarts.
That said, we'd really like to learn how to network Elixir nodes across AWS instances (in an autoscale group) and deploy those using hot upgrades/downgrades.
...but Elixir is awesome
We've been running this Elixir service for about half a year now, and haven't really had to think about it except when we deploy new versions of the Honeybadger package for Elixir; it automatically scales when it needs to, and Elixir itself is a joy to write. That's a huge win for us.
At Honeybadger we're continually looking for new ways to go the extra mile to delight our customers, and we're excited that Elixir can play a part in that.
If you aren't a customer yet and add our Heroku addon to your app then you will start seeing platform errors immediately. Existing customers (both of our addon and Honeybadger.io) will need to do some extra setup to start seeing platform errors. For full instructions, check out the end of this post.
Also, a quick shoutout to ElixirConf 2016, which is happening in Orlando this year. I really enjoyed my first ElixirConf last year, and highly recommend going if you're curious about Elixir and/or want to hang out with a great group of developers.
Questions/suggestions? I'd love to hear them -- email me!


 Molly Struve, Sr. Site Reliability Engineer, Netflix
 Chris Patton, Founder of Punchpass.com
