 By
By If you're a Go developer, we have some great news! You can now monitor your Go applications for panics and errors with Honeybadger! We've been working hard to create the same great error monitoring experience that our Ruby customers enjoy for the Go community, and we hope you'll love the results.
How to get started
To get started, head over to honeybadger.io and sign in or create a new account (if you're not already a user you can sign up for a 30-day free trial). Create a new project and select "Go" as the language. From there we'll give you instructions on how to import and configure our error monitoring client in your application.
If you don't have a go application to work with, but would like to check out our go features anyway, you can use a sample application that we developed for just that purpose. You can run it locally, or deploy it to Heroku with our one-click installer.
Rich Backtraces
Just like with Ruby, the Honeybadger backtrace is more than just a backtrace. You can click on any line and jump directly to the code in Github, Bitbucket or your local editor. You can read it more easily, since we display the backtrace for YOUR code separately from the full trace. And you can even choose which format in which you'd like the trace displayed.
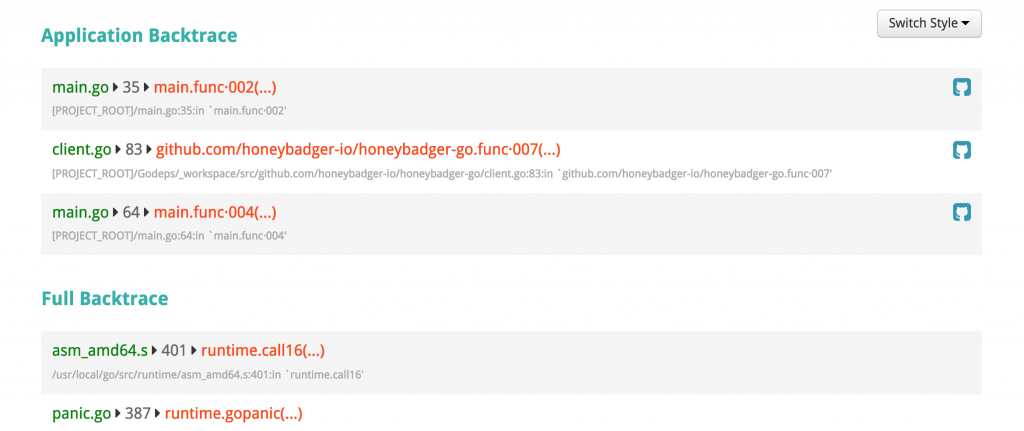 We'll determine which lines of the stacktrace originate in your application and link to the code on GitHub.
Useful Context
Error notifications are so much more useful when enhanced with a little data. And Honeybadger lets you send whatever data you like along with your errors. For example, you can send a the current user's email address, to make post-error followup amazingly easy.
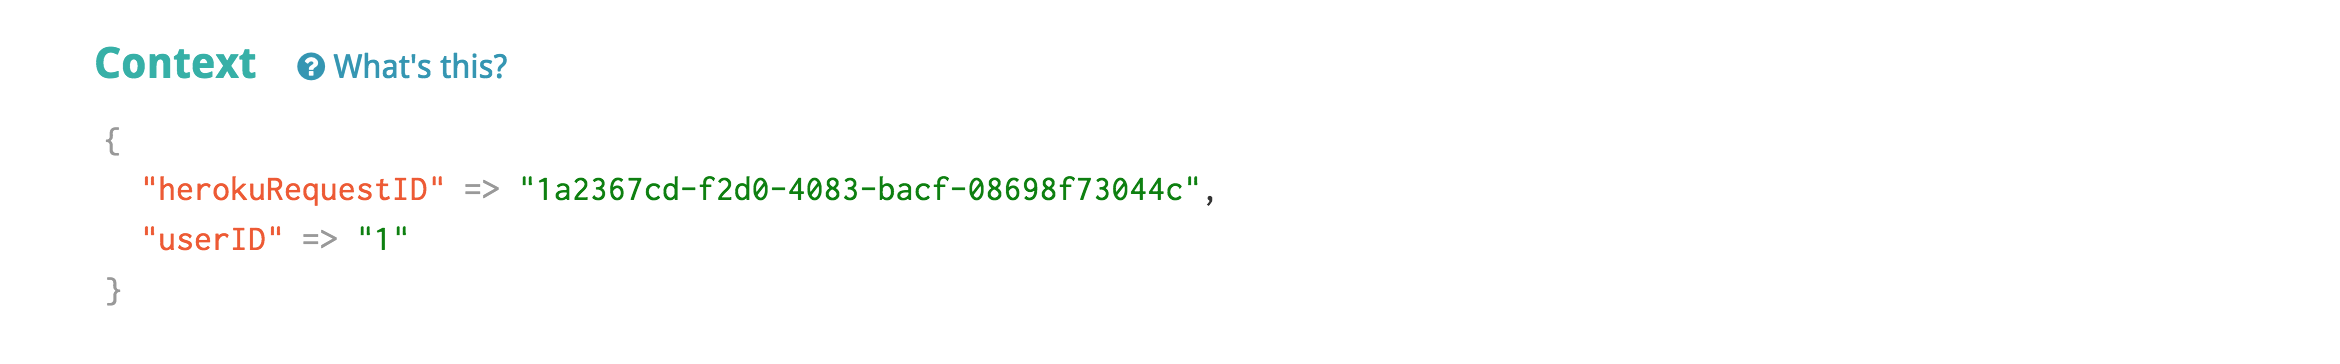 Send additional context data about what's going on before the error occurs.
Environmental Awareness
If you have multiple copies of your application running on multiple servers, knowing exactly where an error came from is critical. Fortunately, it couldn't be simpler. Honeybadger's "app environment" tells you the hostname and process id of the offender. It even shows you a snapshot of RAM and CPU usage at the time of the error!
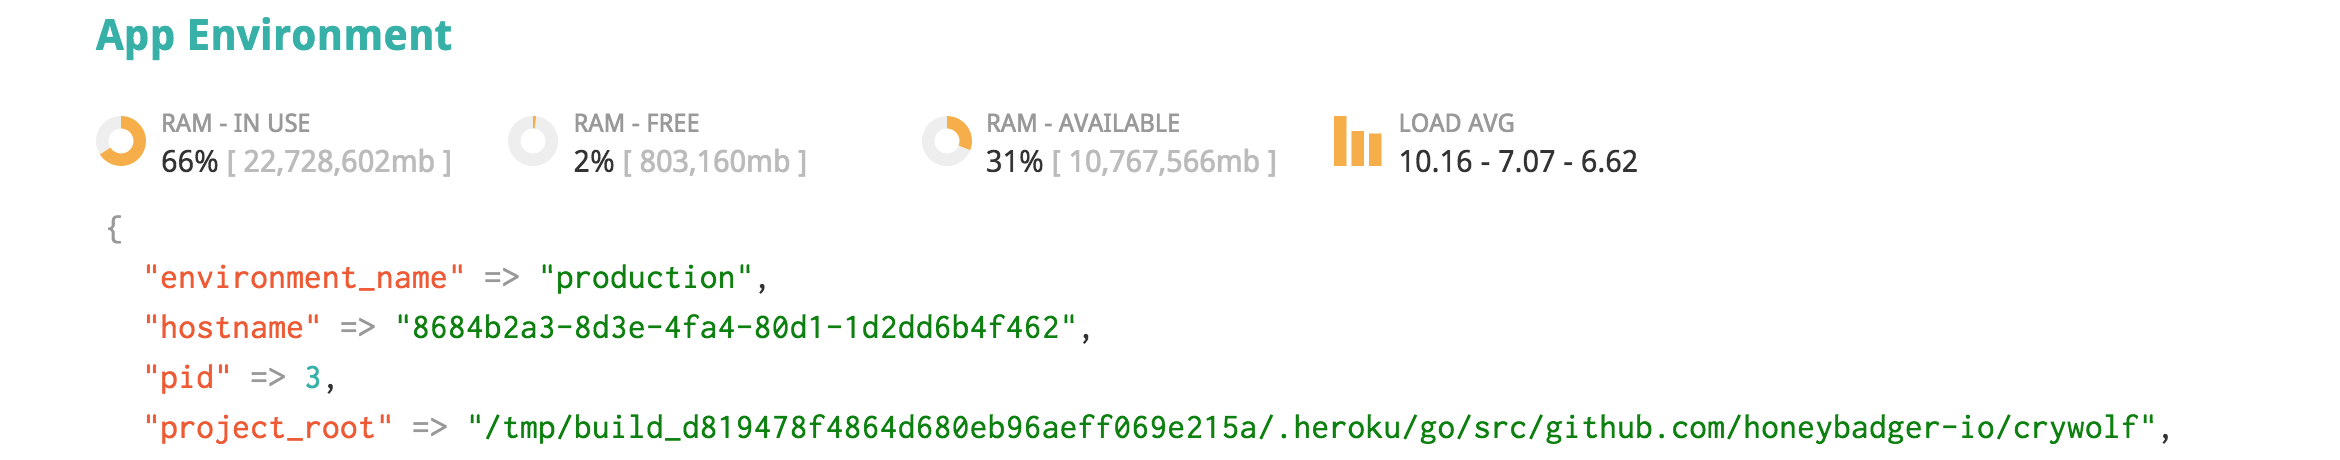 See system stats and other information from your server's environment at the time of the panic.
An at-a-glance summary
As cool as all these details are, you don't always have time to parse them. That's why we provide an incredibly useful at-a-glance summary for every exception.
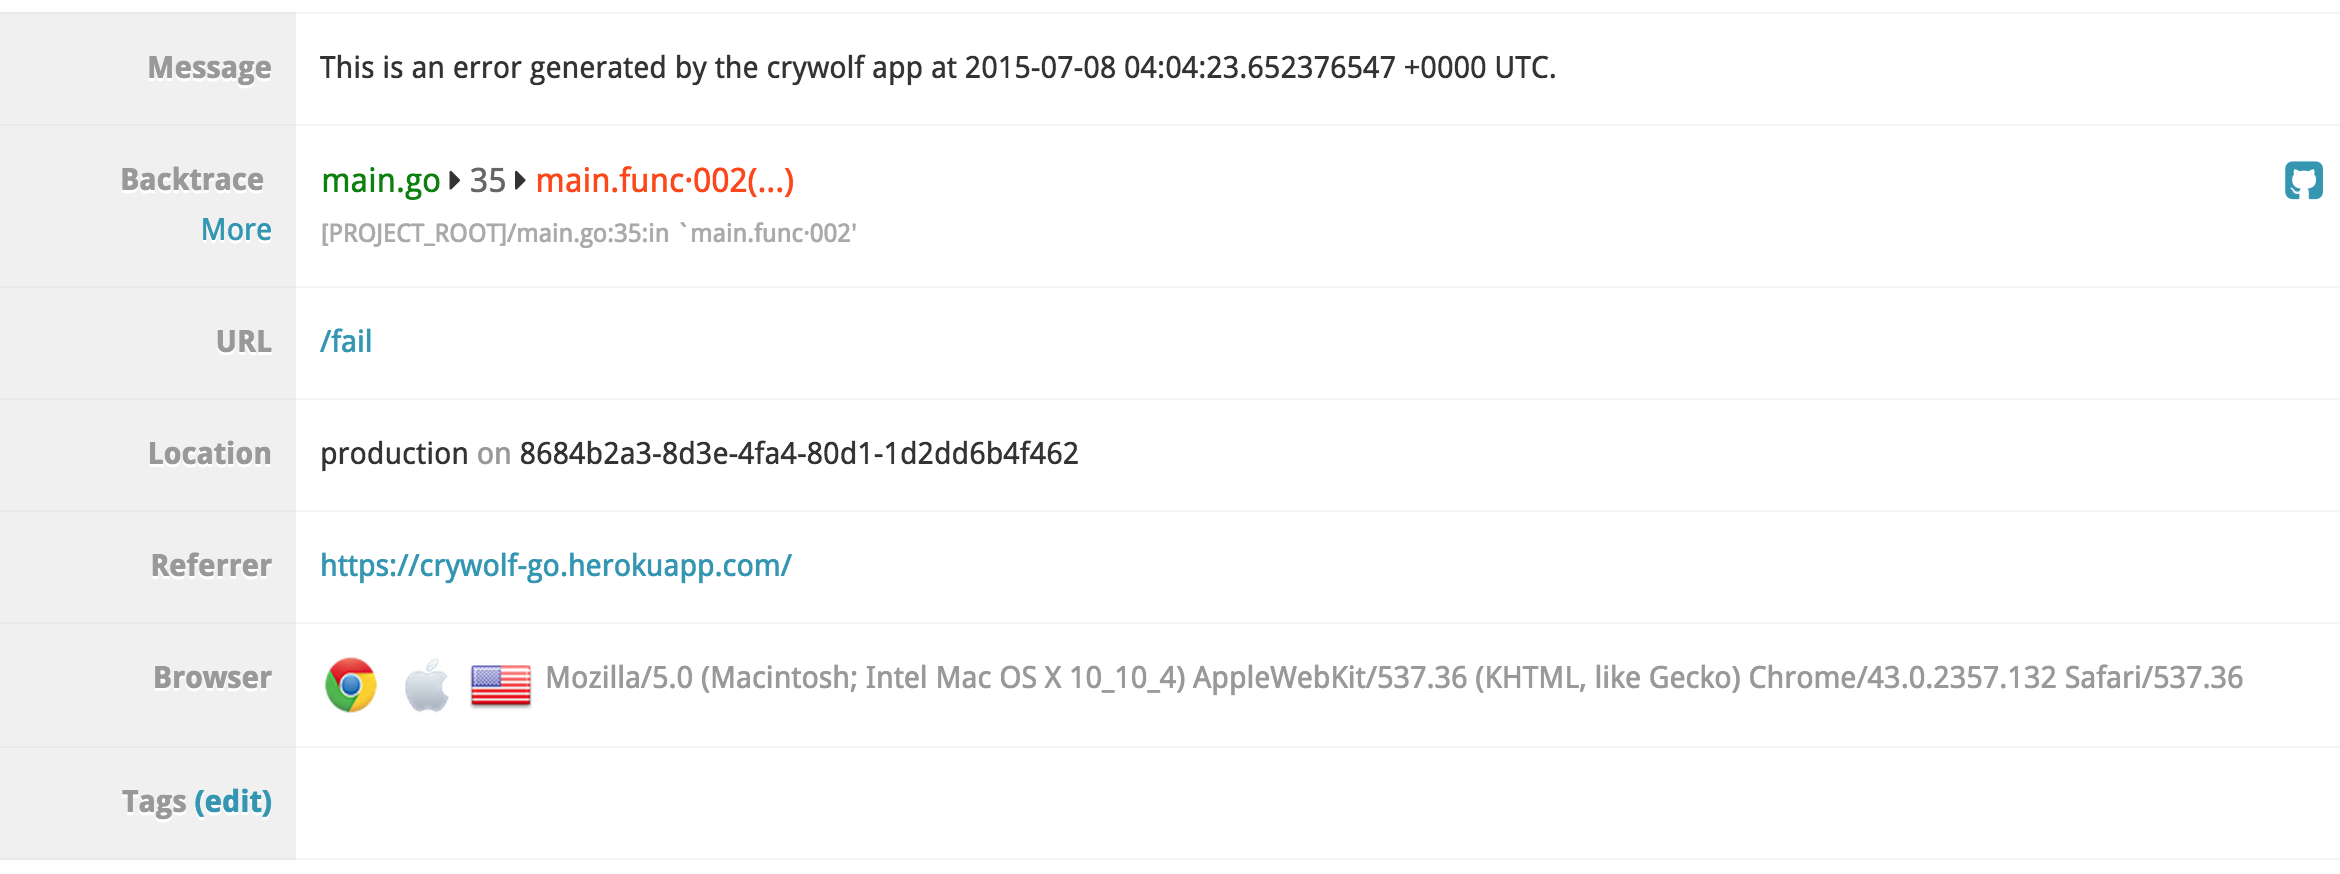 Summary data includes things like URL, Referrer, and browser information from the request.
 Request parameters for faster debugging.
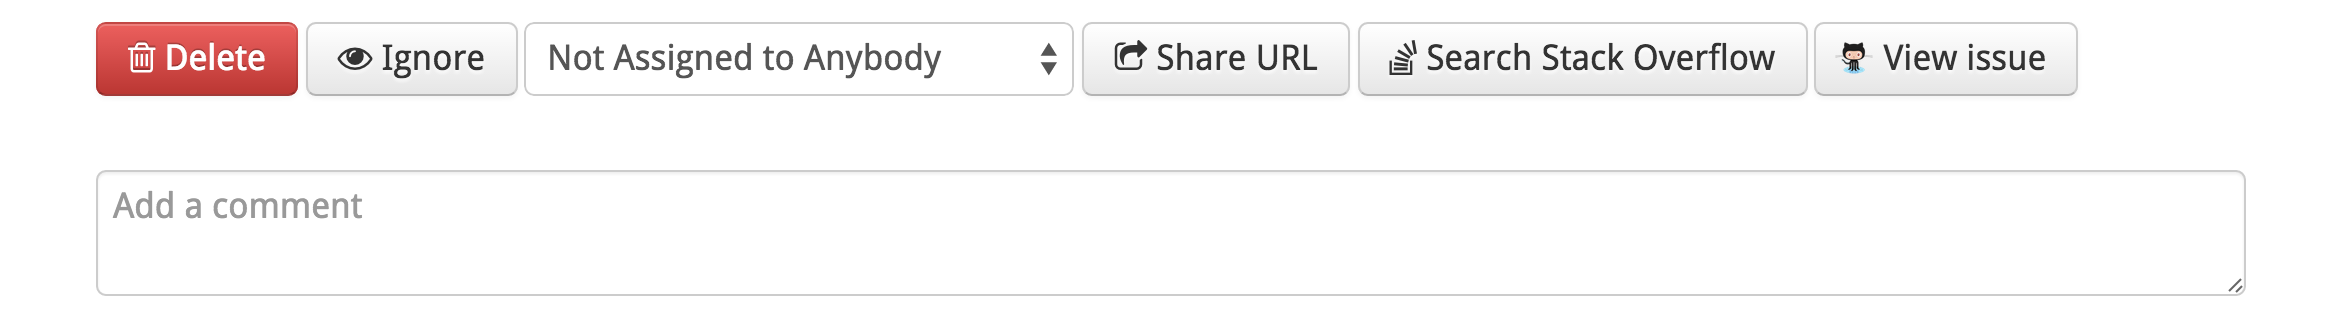 Awesome collaboration and management tools.
We hope you'll give us a try for monitoring your next Go application. Have questions or comments? Drop us a line at support@honeybadger.io -- we'd love to hear from you!


