 By
By You've got bugs, but they're hiding inside your minified JavaScript. Source maps are the key to finding them. Unfortunately, they can be difficult to set up. Luckily, you're a flippin' Honeybadger. We've got your back with the documentation and tools you need swat those bugs.
Good news, JavaScript peeps! We just shipped two big improvements to help with debugging source maps:
- The new Debug Tool can help you figure out why specific frames in your stack traces aren't being translated
- The Uploaded Source Maps list (under project settings) now supports filtering by minified URL and revision
Why Source Maps?
Source maps are essential for tracking JavaScript errors. By the time it reaches your end-users, your production JavaScript looks nothing like the JavaScript you wrote when building your app. Modern build processes have multiple stages where your original source code gets chopped up, optimized, and compressed to squeeze the best performance from it. That's great for performance, but terrible for debugging (and error tracking).
Source maps are the answer. Source maps allow Honeybadger to show your original source code, even if your production code looks like this:
(function(n){function e(e){for(var r,u,a=e[0],l=e[1],c=e[2],s=0,p=[];s<a.length;s++)u=a[s],o[u]&&p.push(o[u][0]),o[u]=0;});
Unfortunately, source maps can be difficult to set up. Build tools tend to handle them differently, there are a lot of configuration options to get just right, and dealing with obfuscated code is just challenging by nature. Don't worry, though—Honeybadger has your back.
The New Debug Tool
We built the new Debug Tool specifically for our customers, in response to common support tickets—it's the quickest way to dig into why your stack traces aren't being translated.
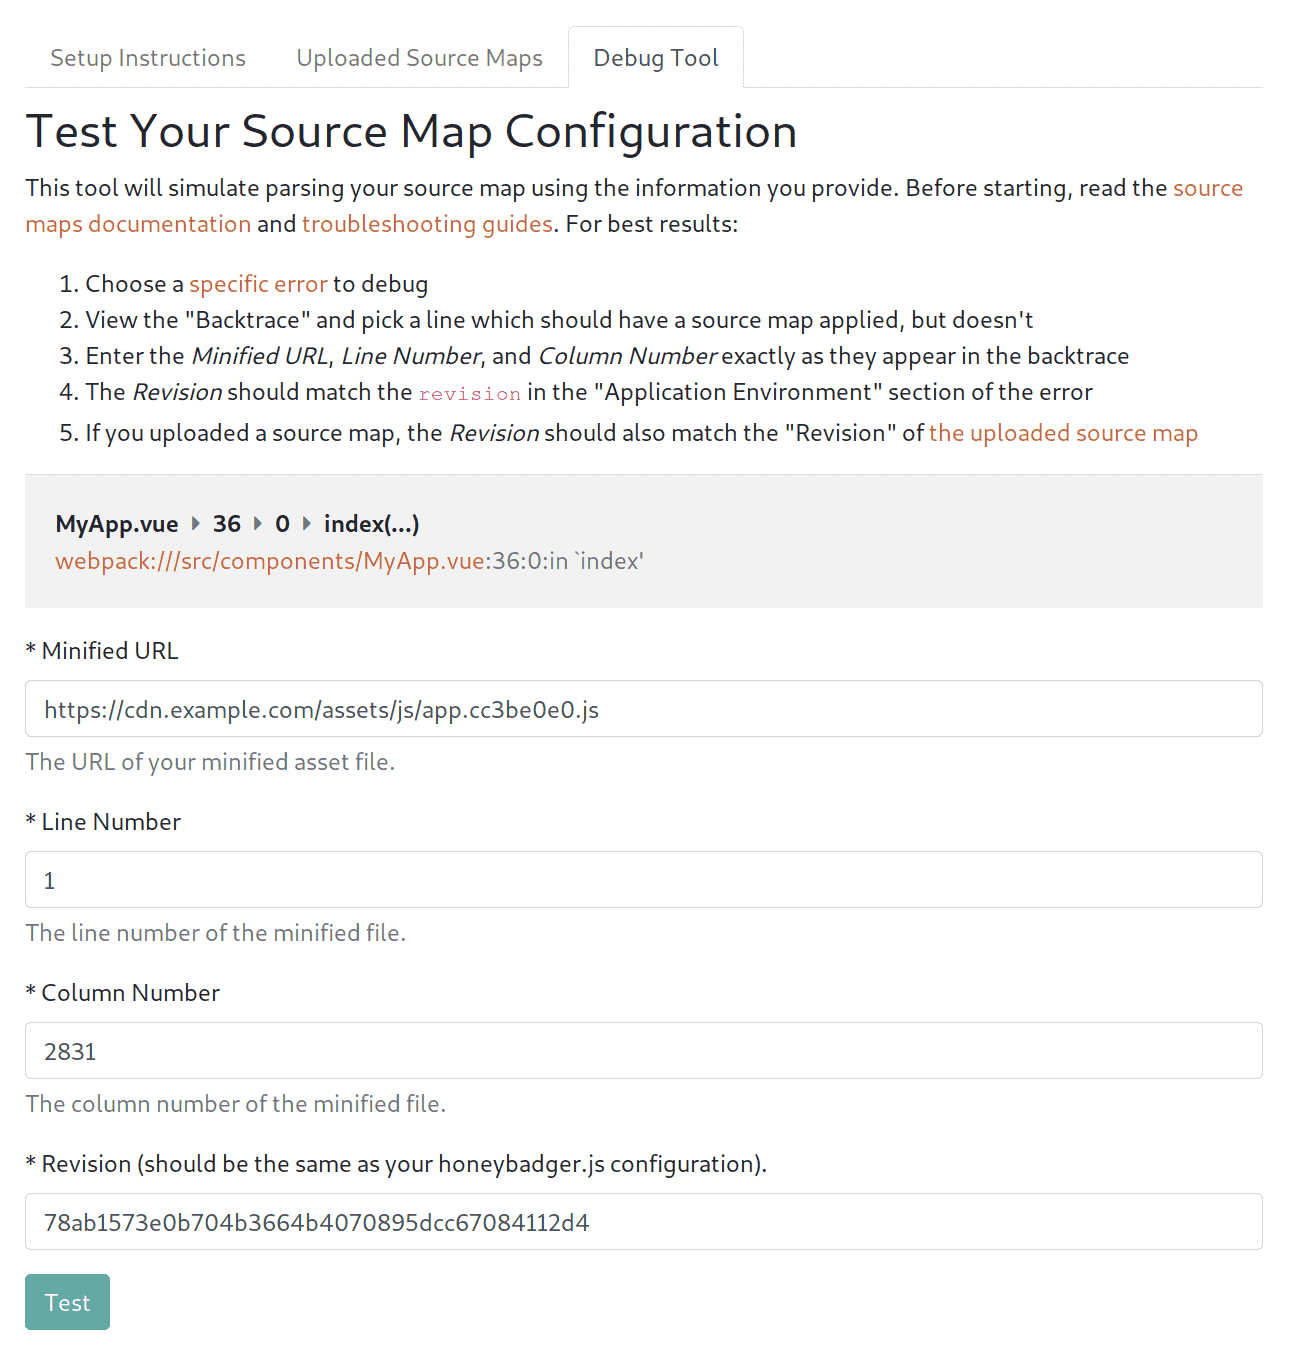
To get started, make sure your Honeybadger project's language is set to "Client-side JavaScript" under Project Settings → Edit, then navigate to Project Settings → Source Maps → Debug Tool.
Follow the instructions on the page. Fill in a URL to your minified JavaScript, the line and column numbers, and the revision, and then run the test. If Honeybadger has a source map for the information you provided, it will show you the translated source line.
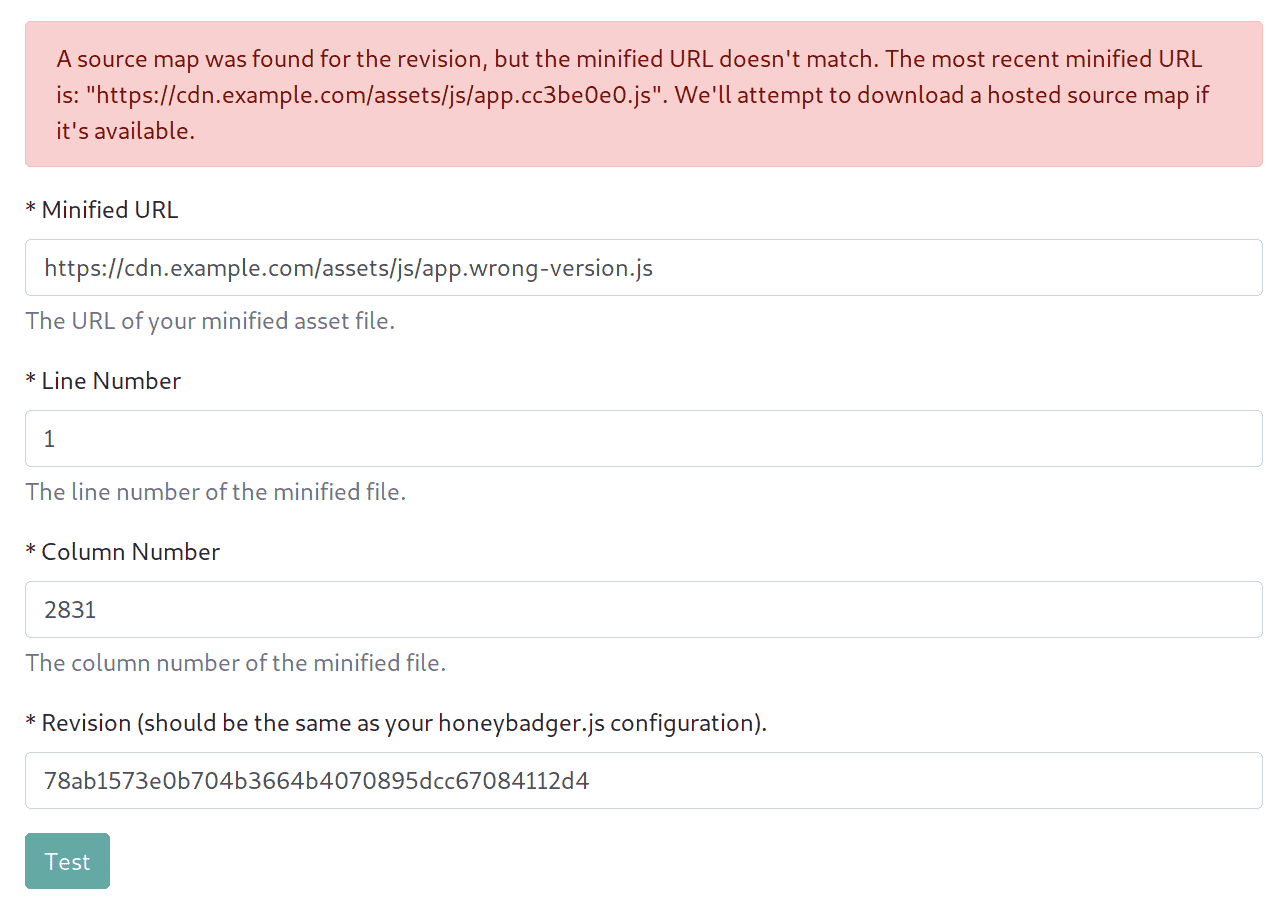
What if it's not working?
If Honeybadger is unable to find a source map for some reason, the debug tool will tell you why; this is the real magic—it can help you troubleshoot the issue. For example, if you enter the correct revision, but the minified URL is wrong, it will give you a helpful error message.
Finding Uploaded Source Maps
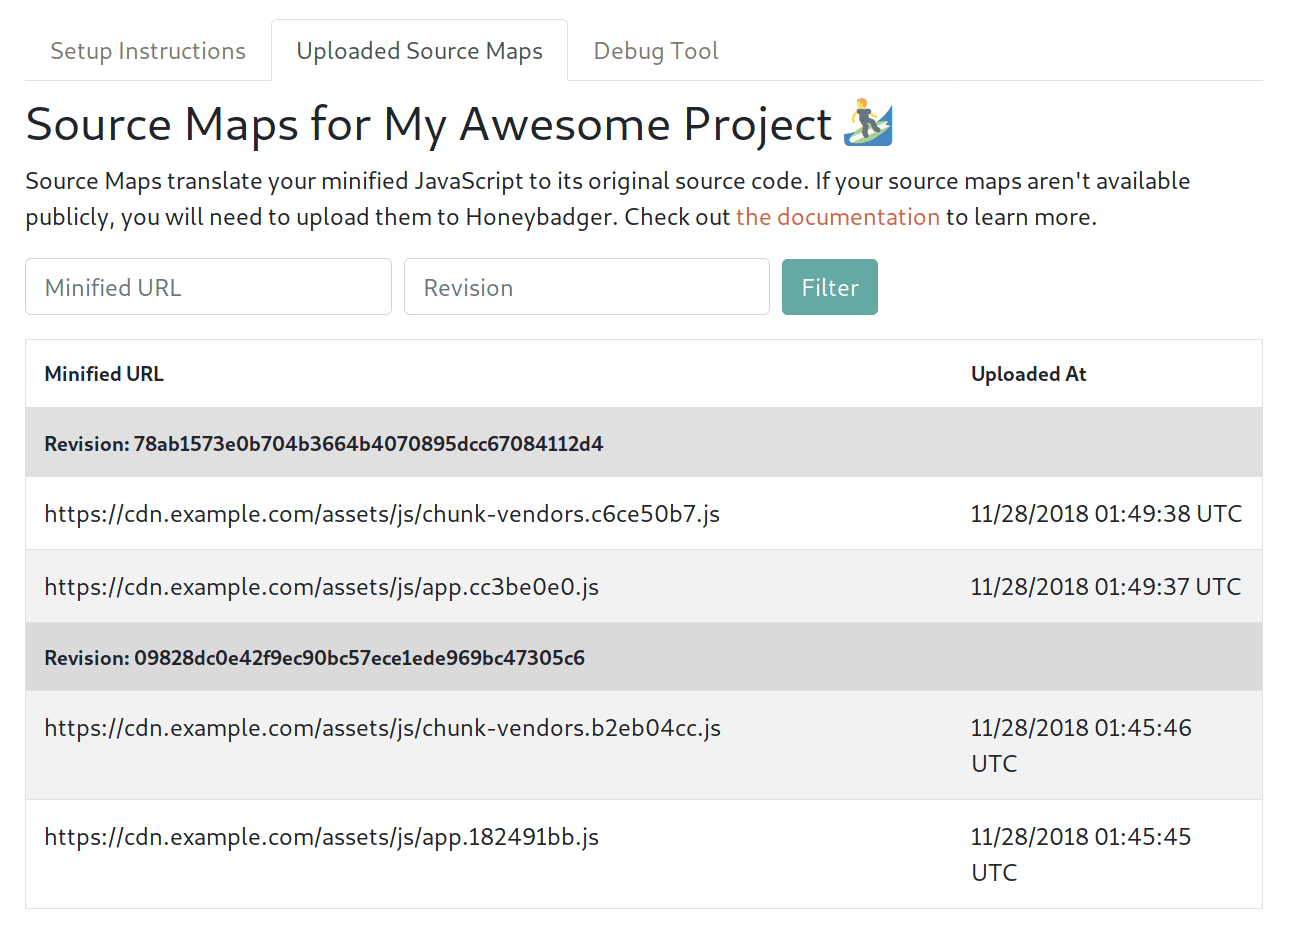
To see a list of all source maps which have been uploaded to Honeybadger, make sure your Honeybadger project's language is set to "Client-side JavaScript" under Project Settings → Edit, and then, navigate to Project Settings → Source Maps → Uploaded Source Maps.
You can now filter your uploaded source maps using the minified URL and revision. This can be used to verify that a particular source map was uploaded. If you're using wildcards, you can paste the full minified URL into the Minified URL input, and the filter will apply the wildcard search to the results, returning the source map that we're using to translate the minified file.
Getting Started with Source Maps
If you're not using source maps yet, start here; it's our guide on using source maps with Honeybadger, and the most up to date version of everything we know.
We're working on tooling to make uploading source maps to Honeybadger easier. For example, Webpack users can install the honeybadger-webpack plugin and call it a day. If we don't support your build system yet, you can still use our API to upload your source maps directly.


 Molly Struve, Sr. Site Reliability Engineer, Netflix
